HPE IMC + iTRACS
Your network manager knows a switch is down. Your DCiM knows which rack it’s in. Only when the two talk to each other do you know who to call and where to go.
WHAT WE ARE INTEGRATING
Network asset data (routers, switches and security appliances) and performance monitoring: CPU, memory, power consumption, temperatures, traffic and port status, mapped onto the physical asset that already exists in the DCiM.
INTEGRATED SYSTEMS
HPE IMC + iTRACS
MAIN OUTCOME
Knowing where each network device physically is and how it’s performing. This turns an alarm on a logical console into an intervention at the right rack, and brings the active network into the data center’s energy equation.
Integration context
Environment: a VM with the two integration services and their databases (containerized deployment with Docker)
The challenge: why was this integration needed?
- Network incident resolution time multiplied by the disconnect between physical and logical. When HPE IMC detects that a switch has traffic errors, high discards or has stopped responding, the network team sees an alarm on a logical console: a name, an IP address, a dot on a topology map. But to act physically — go to the device, check the LEDs, reconnect a cable, replace a module — they need to know which room, row, rack and unit it’s mounted in. Without integration, translating “logical to physical” is a manual process. It can eat up valuable minutes during a critical incident, and it depends on someone keeping a spreadsheet up to date or knowing the room by heart.
- Network capacity planning without physical infrastructure context. HPE IMC knows how much traffic flows through each switch (average and peak RX/TX), how many ports are up vs. total, and how much CPU/memory each device uses. But this data lives in isolation from the physical context: is there space in that rack for another switch? Can the PDU feeding it handle more load? Without cross-referencing network performance with physical capacity, network growth decisions are made blind to the infrastructure that supports it.
- Network power and thermal load invisible to infrastructure management. Switches and routers consume power and generate heat, but they are traditionally treated as “black boxes” in data center energy calculations. HPE IMC has real power consumption (watts) and temperature data (inlet, outlet, chassis, hotspot) for every network device. Without integration, that data never reaches the DCiM. Integrating it makes it possible, for the first time, to include the active network in the data center’s energy equation.
- Proactive detection of at-risk network devices through metric correlation. HPE IMC can show that a switch is running at 85% CPU with growing traffic errors. The DCiM can show that the same switch sits in a rack where ambient temperature has risen 3 degrees over the past week. Separately, neither data point triggers a critical alarm. Together, they point to a device at imminent risk of failure. This cross-correlation between logical performance (IMC) and physical conditions (DCiM) is only possible with the integration. It enables a shift from reactive monitoring to truly preventive management.
- The first challenge was the volume and granularity of the HPE IMC API. The API returns the device inventory in pages, but serial number, device type, firmware version, cards, interfaces and performance metrics must be requested separately, device by device. In a network of any size, a single run means thousands of calls. This made it necessary to parallelize queries, add automatic retries for dropped connections, and allow the most resource-intensive parts of the process (such as per-interface port counting) to be disabled when they aren’t needed in every cycle.
- The second challenge was turning raw data into data the DCiM can use. HPE IMC exposes highly heterogeneous sensors: the same switch can report several temperature probes with different names (inlet, outlet, chassis, fan, hotspot…), and traffic arrives as average and peak RX, TX, errors and discards. iTRACS, however, needs one representative value per device. Each sensor had to be classified by type based on its description, and aggregate metrics (for example, average inlet and outlet temperature) had to be calculated before sending them to the DCiM.
- The third challenge was matching without a common identifier. HPE IMC and iTRACS share no ID. The match between the logical device and the physical asset is resolved by name, serial number and IP. Once found, it is stored as a correlation so that subsequent runs go straight to the right object. In addition, HPE IMC manages all kinds of devices (printers, workstations, cameras, telephony…), so the integration filters them and works only with routers, switches and security appliances.

The systems in the ecosystem
SYSTEM | DESCRIPTION | CONTRIBUTES | RECEIVES |
HPE IMC (Intelligent Management Center) | HPE’s network management platform, which monitors the customer’s network devices: inventory, topology and performance. | Network device inventory (name, IP, serial number, model, firmware, MAC), cards, total and active ports, and performance metrics (CPU, memory, power consumption, temperature, traffic), via its API. | Nothing: it acts as the source in a one-way, read-only flow. |
iTRACS DCIM | Data center infrastructure management system, where the master inventory resides. | Nothing: it is the destination of the data. | Network devices already placed in their rack, enriched with their attributes and performance metrics, in batches, to create or update them. |
The connection diagram
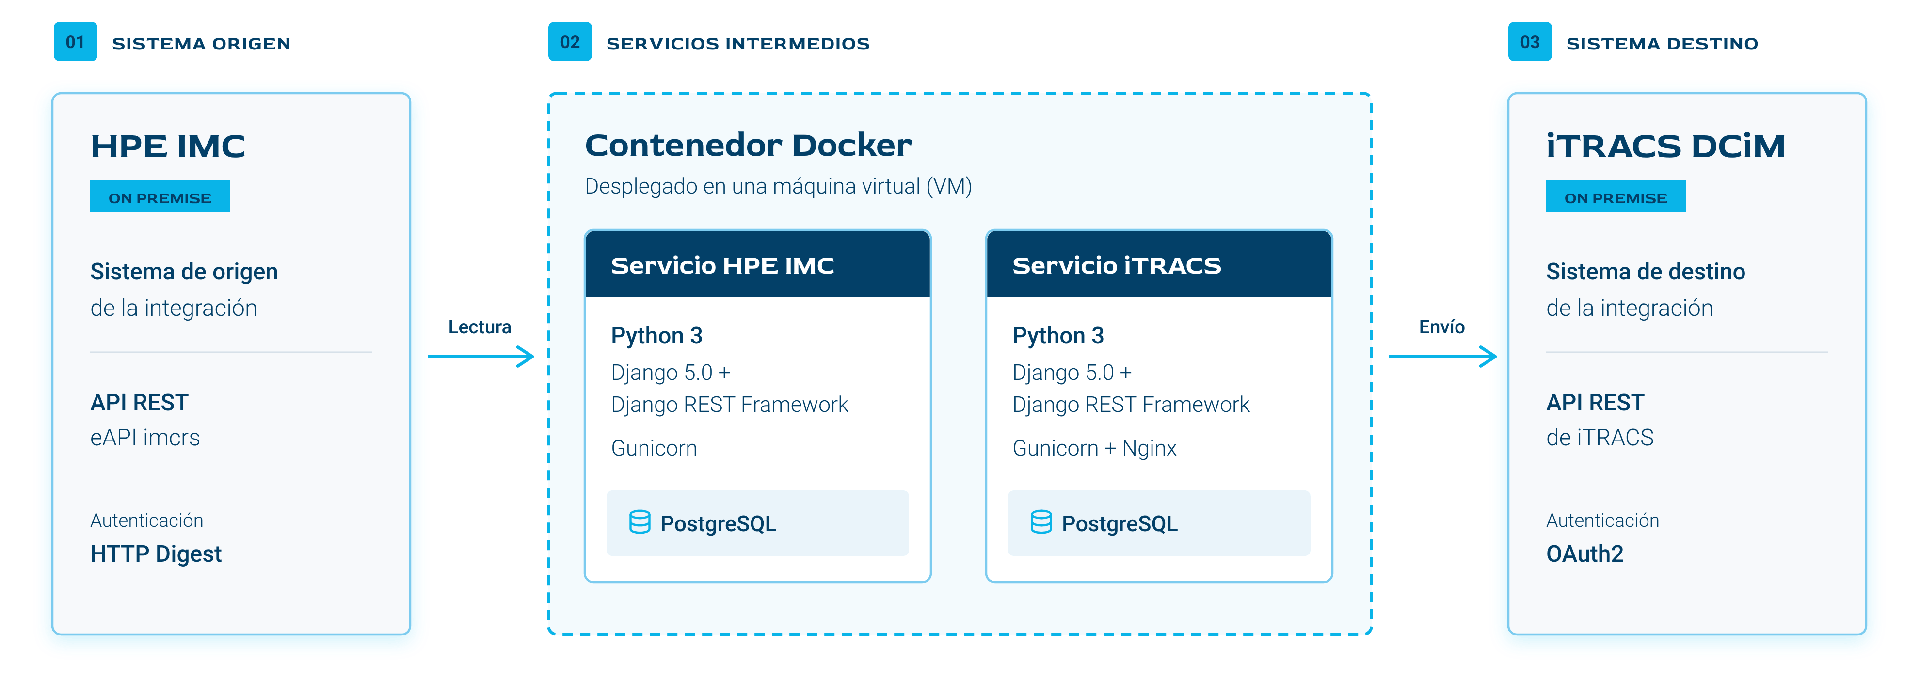
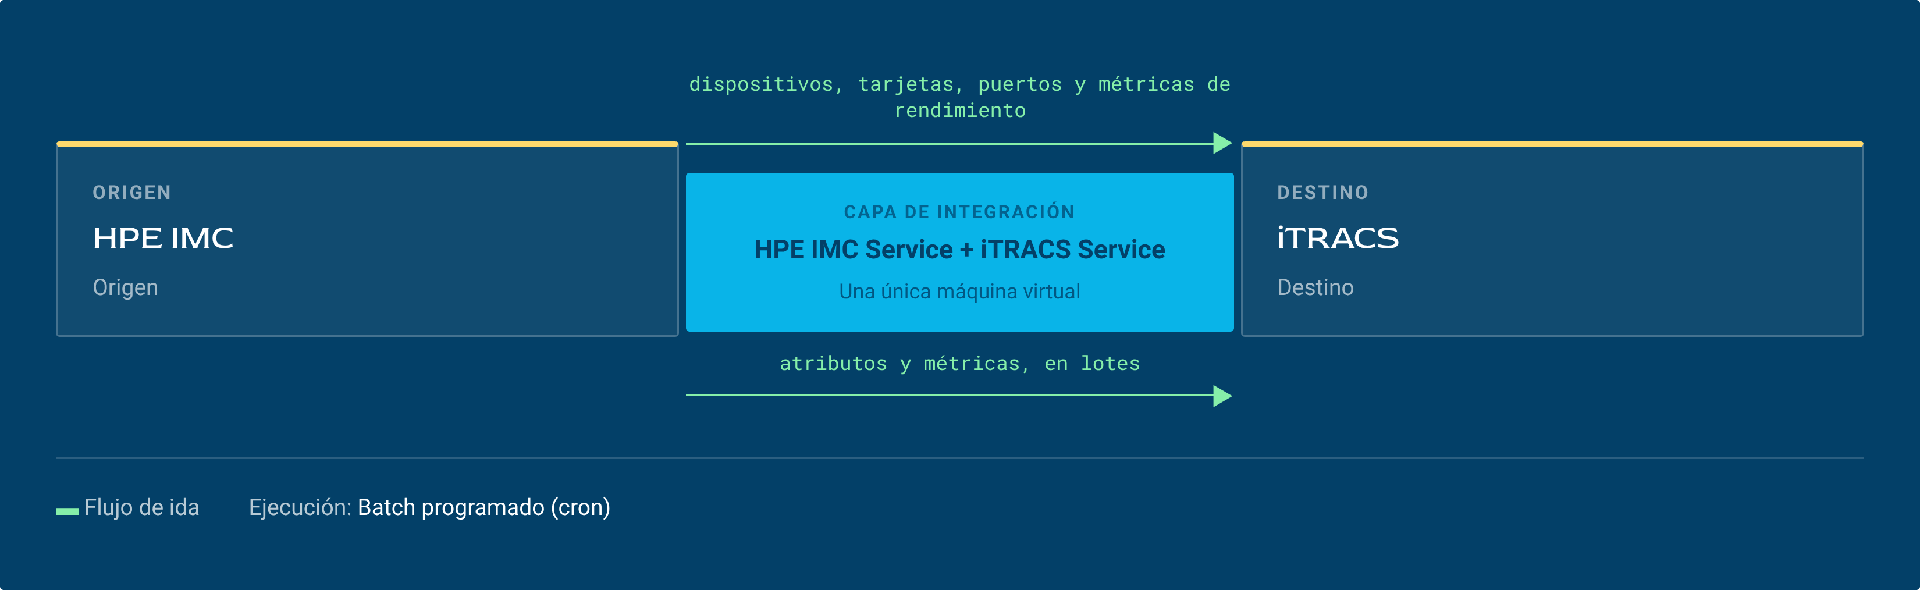
The integration is deployed on a single virtual machine that hosts both services and their respective databases. The two external systems sit outside its perimeter: HPE IMC as the source and iTRACS as the destination. HPE IMC Service is the only component that talks to the HPE IMC API: it extracts devices, cards, ports and performance metrics, normalizes them and stores them in its database. iTRACS Service receives this already-mapped information and writes it to iTRACS, using its own database to correlate objects, control duplicates and retry failures.
Why this architecture
It’s the same two-service architecture we use in our other iTRACS integrations (such as VMware). This lets us reuse the load service and add new sources without touching the DCiM side. Each object is stored with a hash of its content, so each run sends to iTRACS only what has actually changed. The source service is also ready to send data to more than one destination, so the same flow can feed other DCIMs in the future.
Data flow in action
Synchronization flow for network devices and their metrics: from HPE IMC to iTRACS
Crontab launches the HPE IMC Service ETL. An execution lock prevents two cycles from overlapping if one runs long.
For each device, it queries in parallel its serial number, type and firmware version, counts its total Ethernet ports and retrieves its cards.
It retrieves each device’s performance metrics (CPU, memory, power consumption, temperature, RX/TX traffic, errors and discards), classifies each sensor by type and calculates aggregate metrics per device (for example, average inlet and outlet temperature).
HPE IMC Service asks iTRACS Service for the HPE IMC data source ID and sends it, in batches, only the assets and metrics that have changed.
VOLUME
In each cycle, only the objects that have changed are sent to iTRACS, in batches of configurable size.
FREQUENCY
Scheduled batch execution, with frequency configurable to the data center’s needs.
What made the difference
Design decisions that weren’t the obvious ones, and why we made them.
Key decision 2: From sensor to metric
Instead of dumping hundreds of raw probes into the DCiM, the integration interprets HPE IMC sensors, classifies them by type and consolidates them into a small set of per-device metrics that a DCIM knows how to use: % CPU, % RAM, power consumption in W, and inlet and outlet temperature. The data arrives ready for capacity analysis and for including the active network in the data center’s energy and thermal balance.
Key decision 1: Delta-based synchronization
Each device, sensor and metric is stored with a hash of its content. In each cycle, incoming HPE IMC data is compared with what is stored, and only what has changed is sent to iTRACS. Devices that disappear from the network are marked as inactive instead of being deleted. This drastically reduces the number of writes to the DCiM and allows synchronization frequency to increase without affecting its performance. Execution is also configurable: you can sync the full inventory or only the relevant device types, skip port counting in fast cycles, or launch a dry run that doesn’t write to the destination.
Shall we talk about your integration?
Tell us which systems you have and which ones you need to talk to each other.